See The Point Target For Every DFS Salary
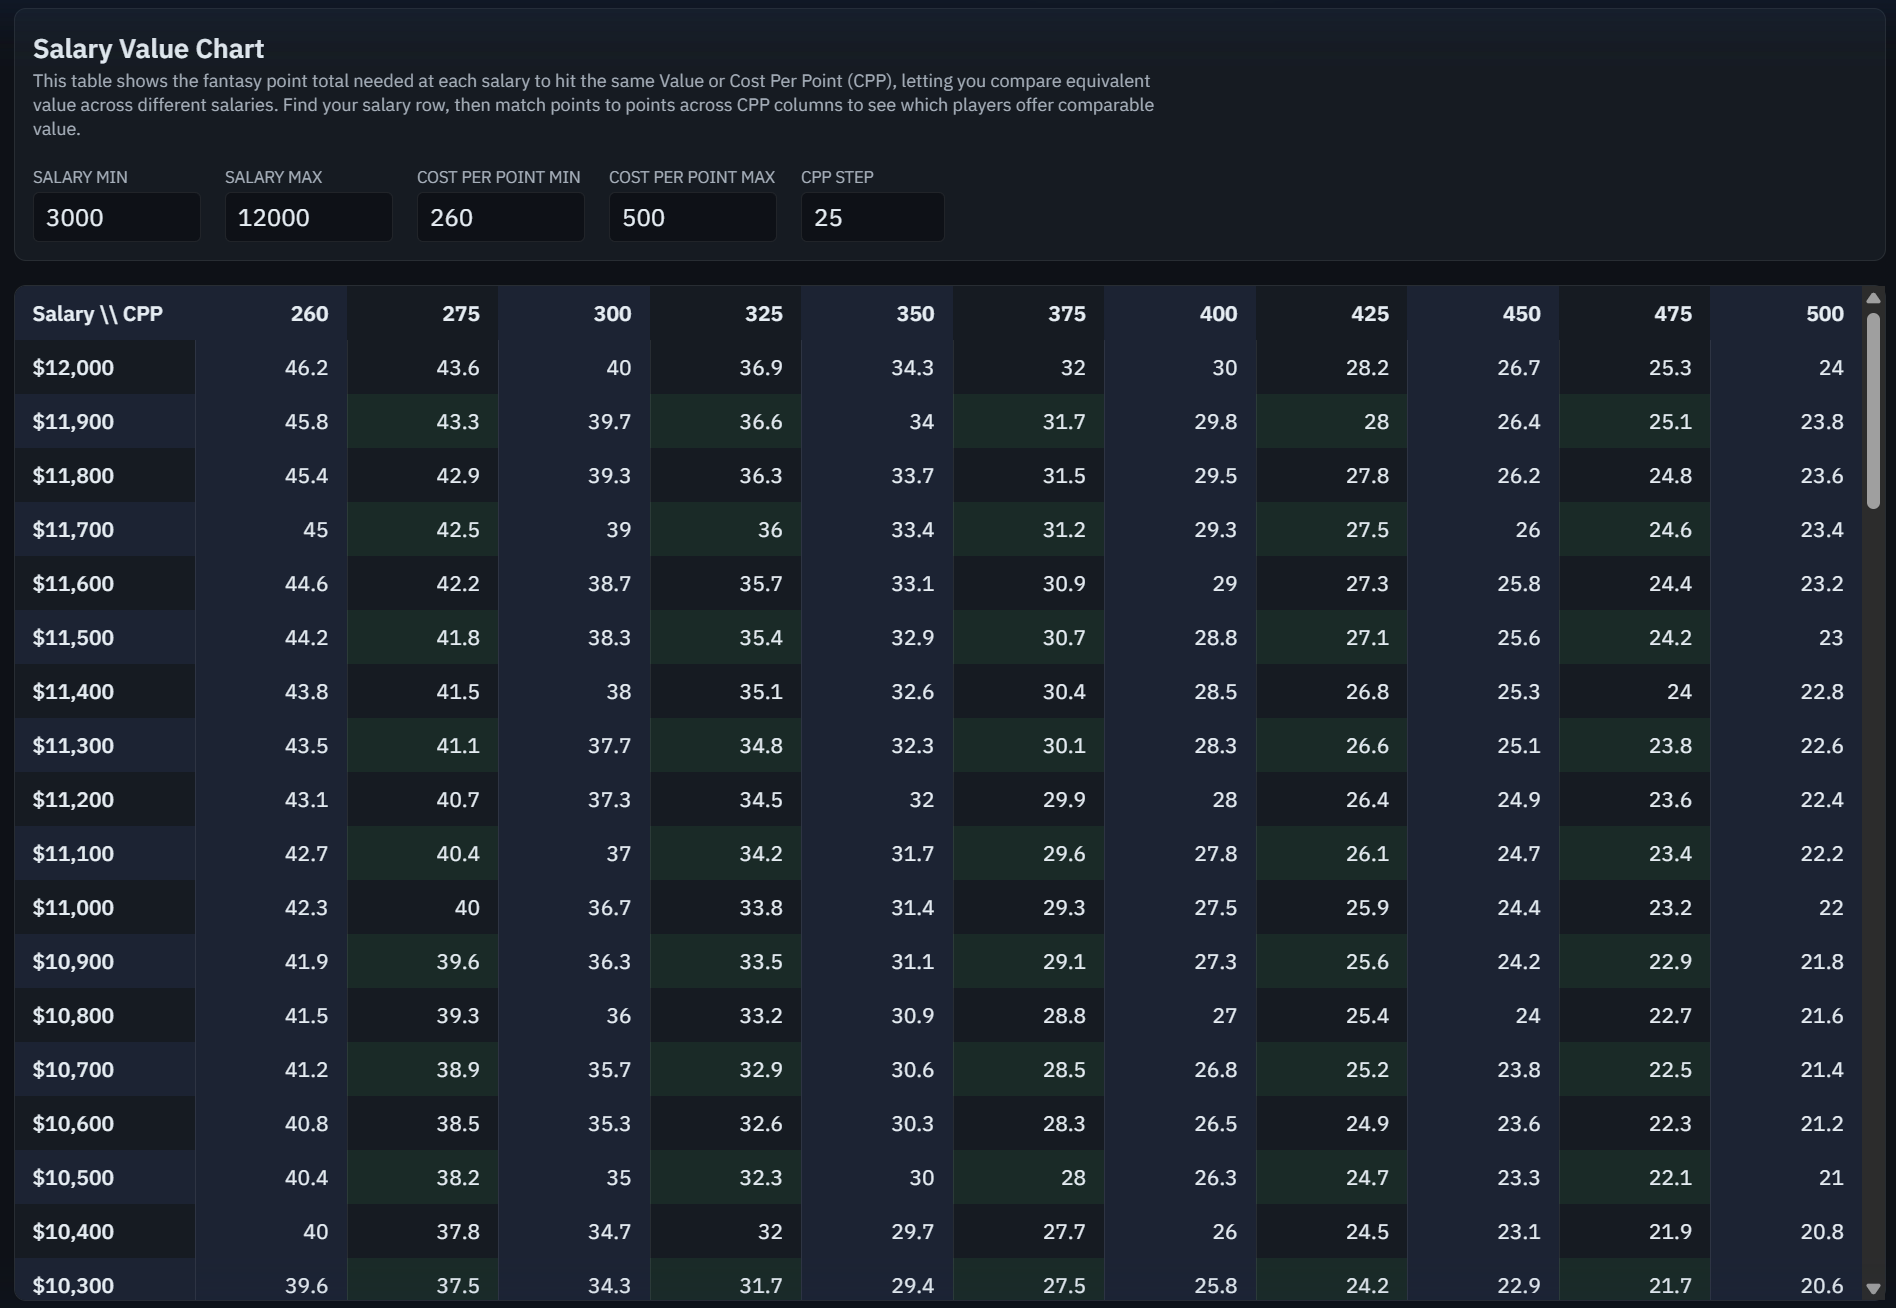
Set the salary and Cost Per Point ranges to see how many fantasy points each salary must produce to return the same value.
Compare FanDuel and DraftKings salaries, projected points, actual results, and points per dollar to find NFL DFS value plays. Filter by slate, week, position, salary, and cost per point, then study historical value frequency and player outcomes at a glance.
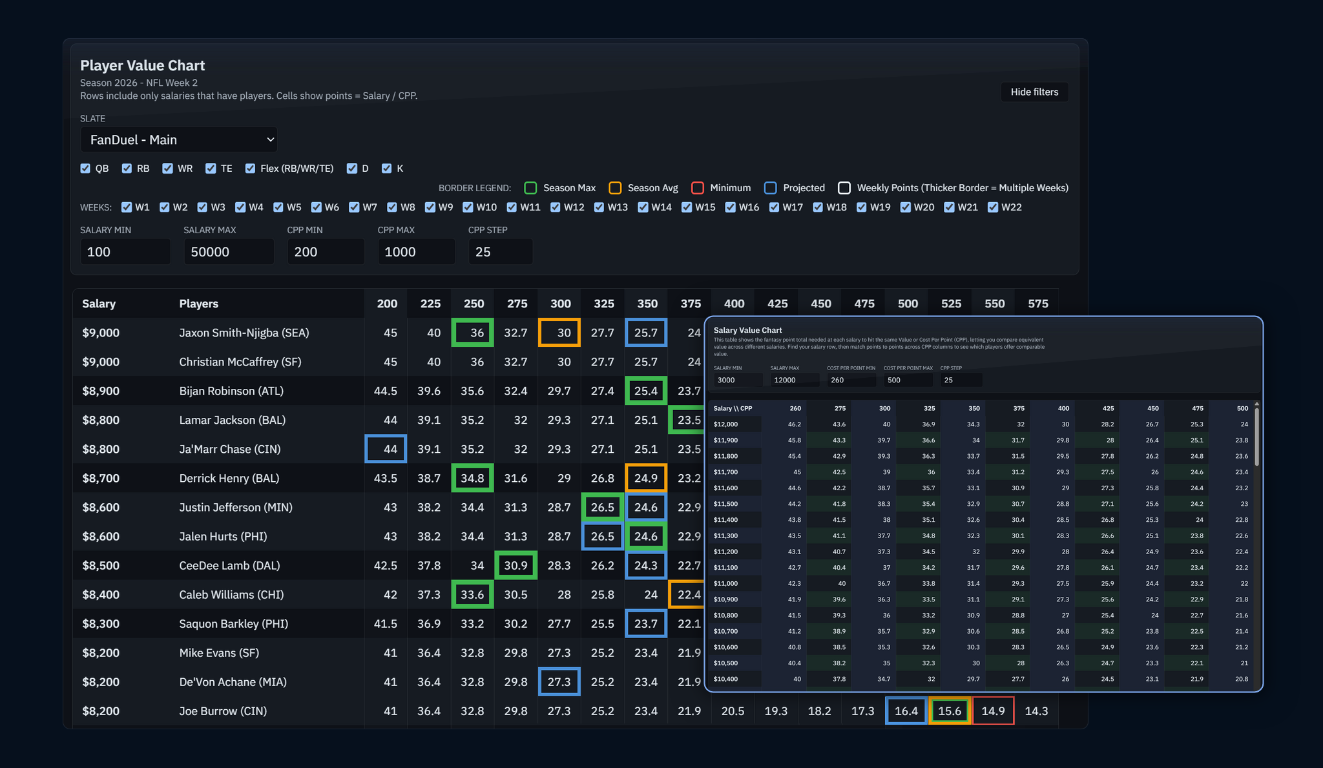
Value Matrix connects comparable salary-value targets with detailed NFL player results, giving you more context for every DFS value decision.
Set the salary and Cost Per Point ranges to see how many fantasy points each salary must produce to return the same value.
Compare each player's season maximum, average, minimum, projected points, and weekly results in one view.
Filter by FanDuel or DraftKings slate, selected weeks, position, salary range, and Cost Per Point to compare player value within the exact contest and historical context you choose.
Use weekly results and season ranges to understand each player's floor, typical production, upside, and historical value frequency.
Start with the point totals required at each salary, then compare player projections and results against the same Cost Per Point scale.
See how many fantasy points each salary must produce to reach the same Cost Per Point. Adjust the salary and Cost Per Point ranges to compare value across different salary levels.
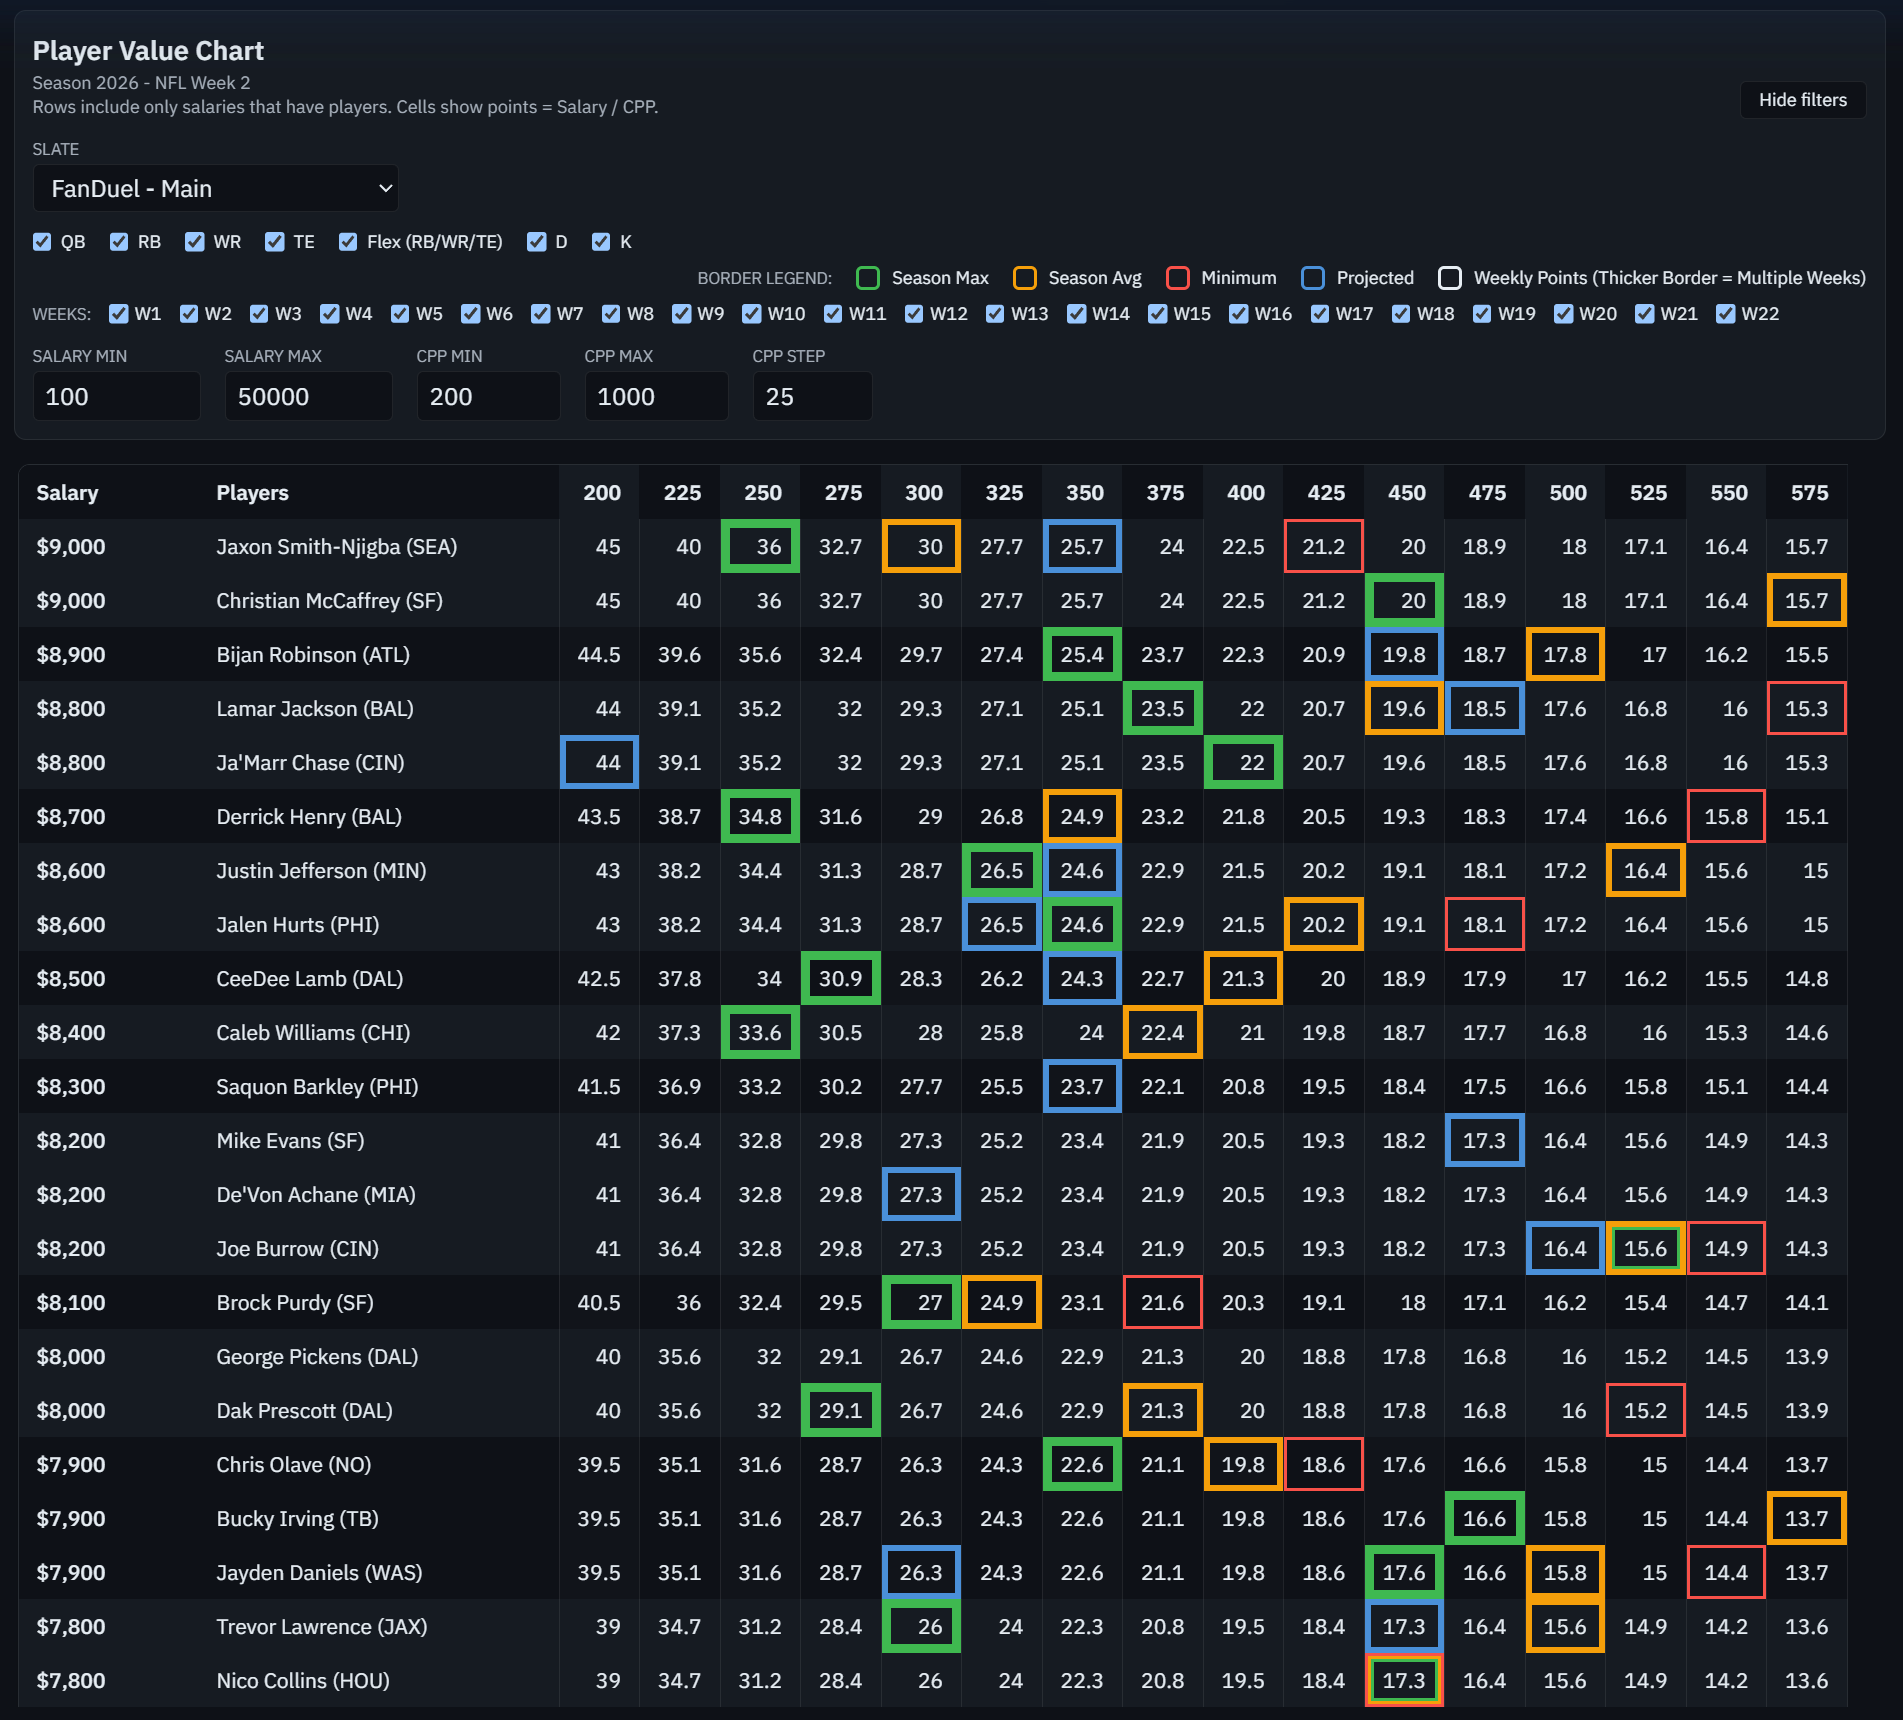
Compare each player’s season maximum, average, minimum, projected, and weekly points against the same Cost Per Point scale. Filter by slate, selected weeks, position, salary range, and Cost Per Point.
Open the Salary Value Chart for equivalent point targets or the Player Value Chart for detailed analysis of individual players.
Choose the FanDuel or DraftKings slate, selected weeks, position, salary range, and Cost Per Point range you want to analyze.
Use salary benchmarks, projections, season ranges, and weekly outcomes to compare player value and make more informed lineup decisions.
Yes. To celebrate our launch year, every tool and feature on Fantasy Football Analysis is fully unlocked for the 2026 NFL season. No subscription or payment information is required. All you need is an email address to create your account and log in.
Value Matrix combines salary, projected points, weekly results, season ranges, points per dollar, and historical value frequency so you can compare players and identify the value plays that fit your slate and strategy.
The Salary Value Chart shows the fantasy point totals required to produce equivalent Cost Per Point value across different FanDuel and DraftKings salaries.
The DFS Player Value Chart shows each player’s season maximum, average, minimum, projected points, and weekly results on the same Cost Per Point scale. Color-coded markers make it easy to see how each result compares, while filters for slate, selected weeks, position, salary range, and Cost Per Point let you evaluate player value within the exact context you choose.
Yes. Choose a FanDuel or DraftKings slate to analyze player value using the salaries for that platform and contest.
Explore Value Matrix free and turn DFS salary and player value research into more informed decisions.
No subscription or payment information is required.